

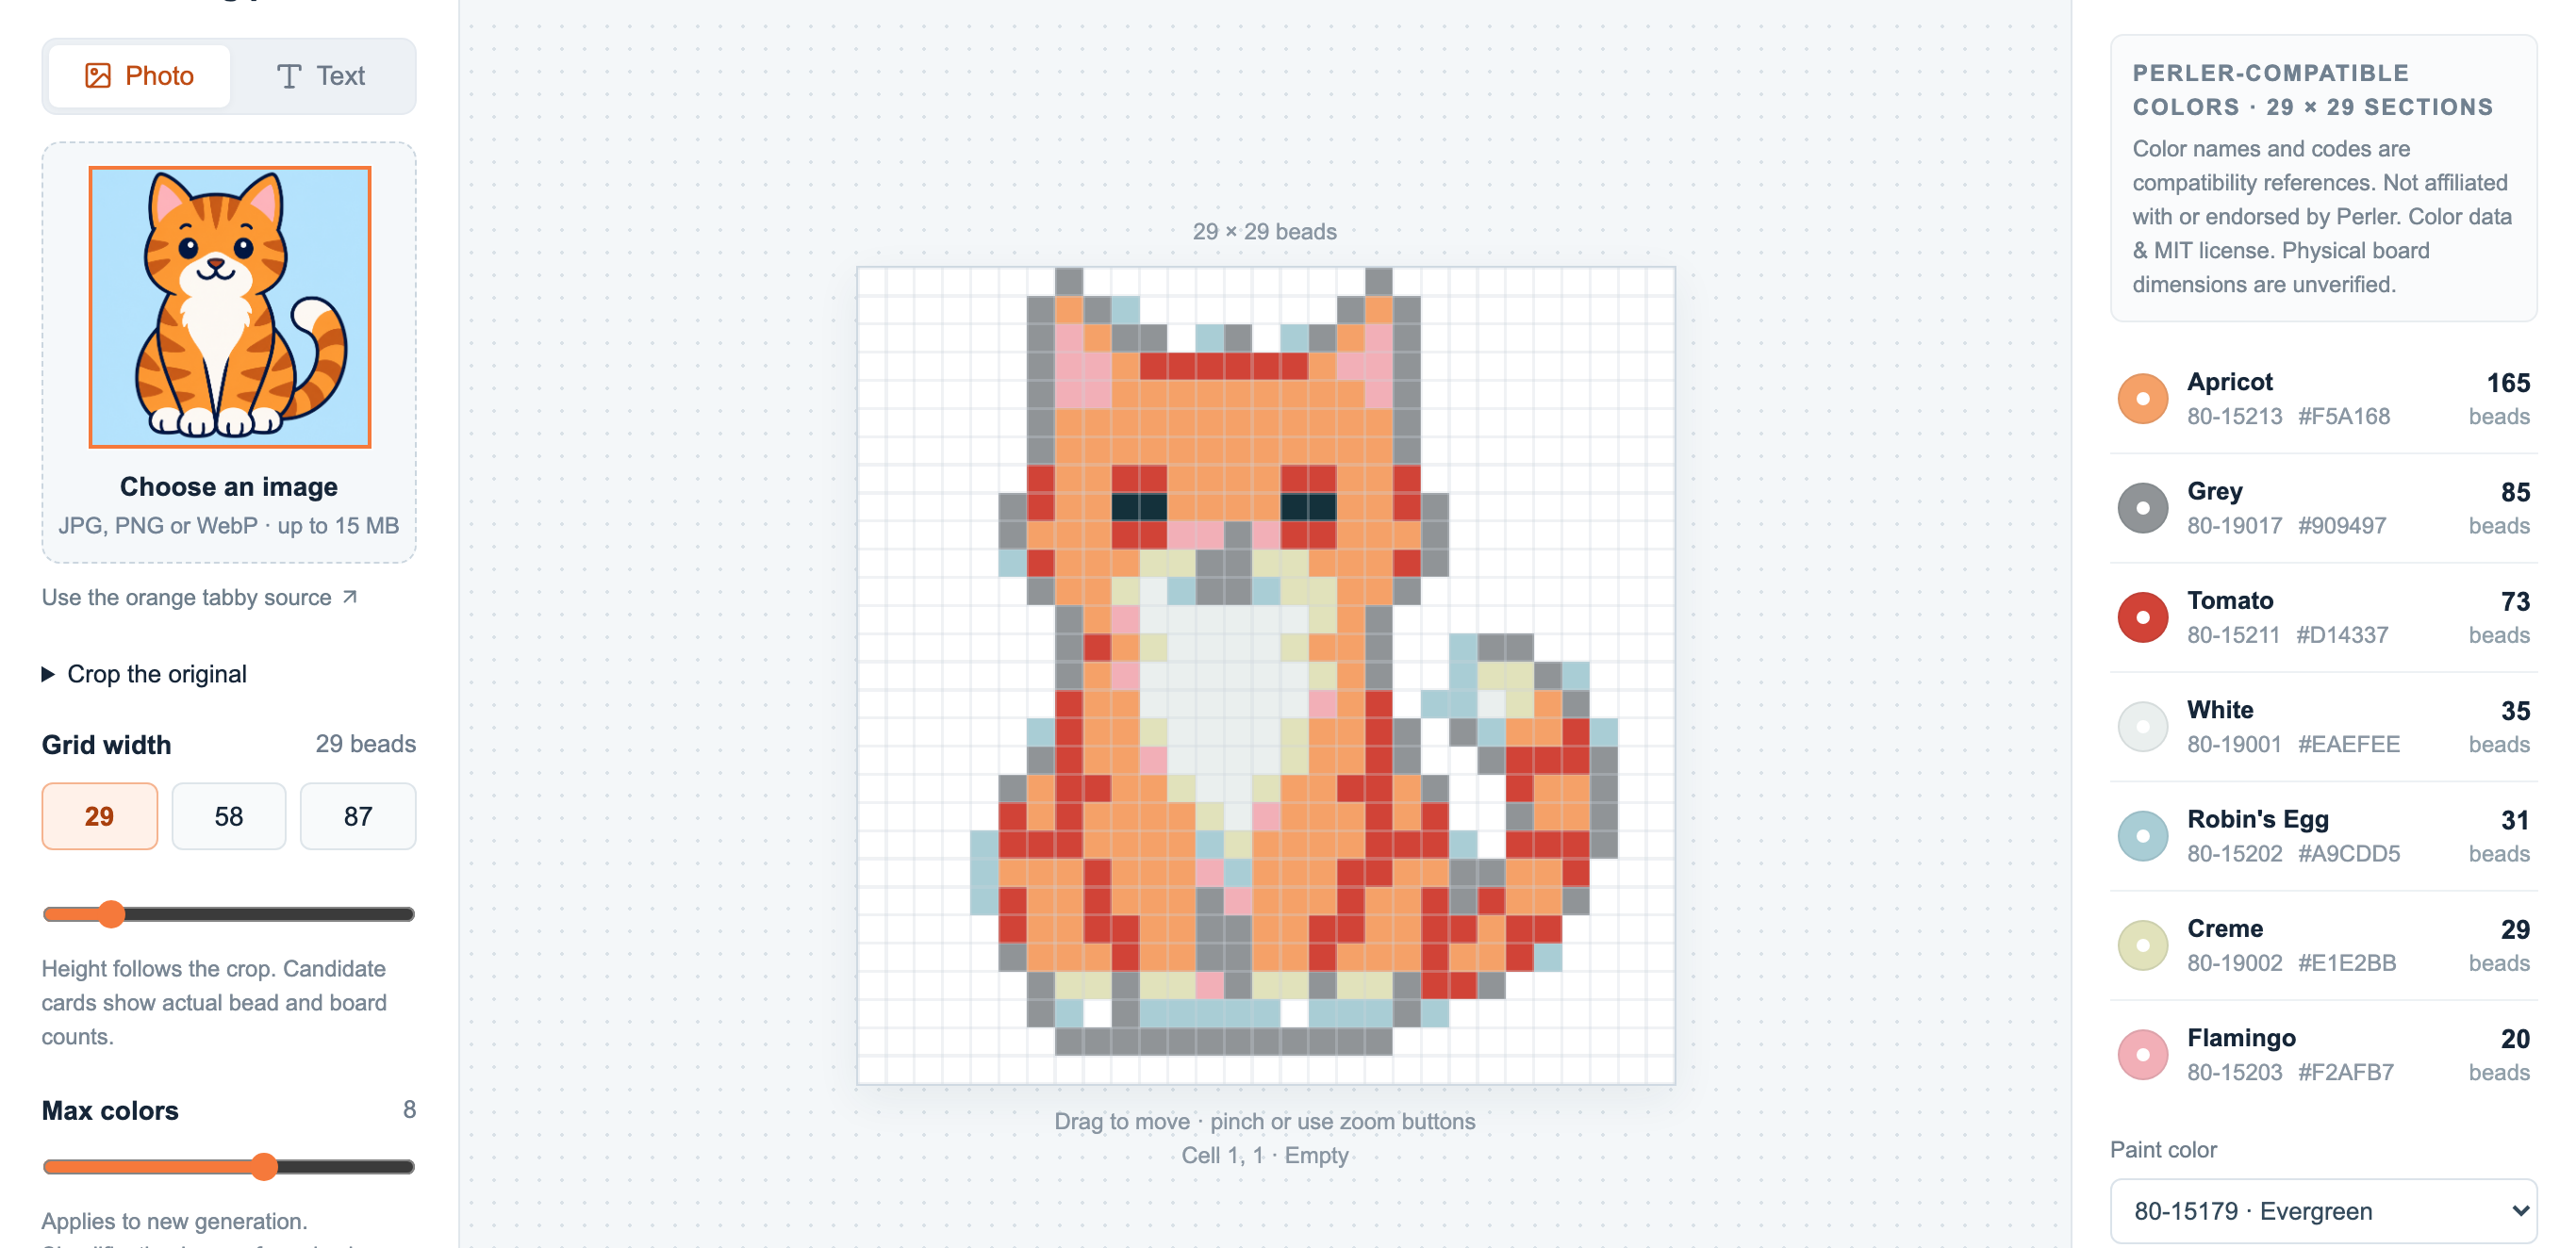
A pixel art grid is a fixed grid of cells where each cell holds one flat color. In the pattern maker you turn a photo or a short word into that grid, then read it three ways — grid, beads or symbols — with a live count of every color beside it. The grid is 12 to 120 cells wide, uses up to 12 colors from a real Perler palette, and prints as a chart that lines up with a pegboard. It is free and runs entirely in your browser.
What a pixel grid actually is
The grid is the whole picture: a rectangle of square cells, each one a single solid color. The width in cells is the resolution — 29 cells wide is chunky and poster-like, 120 keeps far more detail; the height follows the part of the image you crop, up to 120 rows. Every cell is snapped to the nearest shade in a real Perler bead palette (103 shades), so the grid isn’t just an on-screen effect — it maps one cell to one bead.
Three ways to read the same grid
The grid never changes; only how you look at it does:
- Grid — flat colored squares with grid lines, the clearest view for editing and for seeing the shape.
- Beads — each cell drawn as a round bead, so it looks like the finished fuse-bead piece.
- Symbols — each color shown as a symbol, which is what you follow when you’re placing beads and don’t want to mix up two close shades.
Zoom runs from 50% to 400% so you can work cell by cell or step back and see the whole grid.
Color counts, kept live
Beside the grid is the color list: every shade you’re using, by code and name, with how many cells use it. It updates as you edit, so you always know the totals — useful for checking you have enough of a color before you start, and for a quick sense of which shades dominate. The CSV export writes the same list with exact counts, and the header shows total beads, number of colors and the grid’s width × height.
Reading the grid on a pegboard
The printable PDF chart splits the grid into 29 × 29 sections — the size of a standard square pegboard — with symbols and per-section counts, on A4 or US Letter. That’s what makes a big grid buildable: you read one 29×29 block at a time next to the board instead of losing your place in a single huge sheet. It is a reading chart, not a 1:1 template, so check the shades against your actual beads.
Editing and exporting the grid
Every cell is editable — paint, erase and fill, replace one color everywhere in a step, protect cells you’ve finished, and undo or redo one stroke at a time. When it looks right, export the confirmed grid:
- PNG — the grid as a flat image, empty cells transparent.
- CSV — the color list with exact counts.
- PDF — the 29×29 reading chart with symbols and counts.
- JSON — an editable project you can reopen later.
New here? Making pixel art on a grid covers the whole flow, and choosing the right size explains how width changes how the grid reads.