

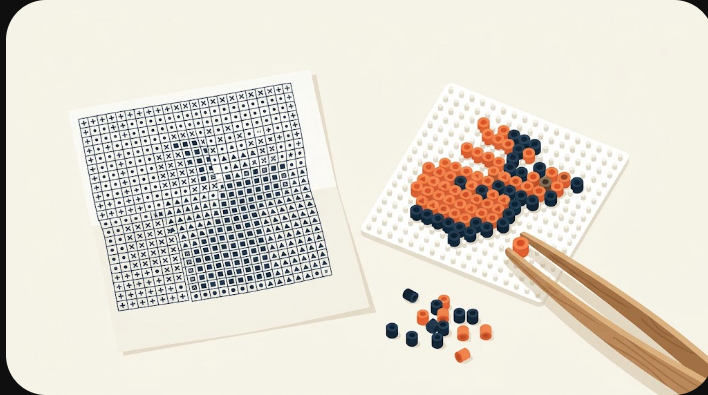
Export the PDF reading chart. It splits your grid into 29×29 sections, prints a symbol and the color in every cell, and lists the bead counts — it is built to sit next to your pegboard while you work. One thing to be clear about up front: it is a reading chart, not a life-size template. Do not lay beads on the paper and expect them to line up.
What is on the reading chart
Three things, all designed for reading rather than tracing:
- A sectioned grid. The pattern is divided into 29×29 blocks so you can keep your place across a large piece and match it to a pegboard section by section.
- A symbol and color in every cell. Each occupied cell shows both, so you can read it even where two shades look alike on paper.
- A materials list. The exact bead count per color, taken from the version you applied.
Why it is not 1:1
Two reasons, both honest limits rather than missing features. First, the color on your screen is not the color of your beads — monitors and printers each shift shades, so a printed swatch is a guide, not a match. Second, printers scale pages to fit their own margins, so “actual size” would not survive the trip through a print dialog anyway. The chart solves this by not pretending: it gives you a grid to read, section by section, and leaves the physical placement to your pegboard. Bead strength, exact shade and finished timing are things only your real materials can settle.
Symbols and views do two jobs
Every cell carries a symbol as well as a color, and that matters for two groups of people. It helps anyone printing in black and white or reading close shades that look identical on paper, and it helps anyone who does not distinguish those colors easily. On screen you can switch between Beads, Grid and Symbols views; if your pattern uses close shades, flip to Symbols before you export and confirm each one is legible at your printed size. It is far cheaper to catch an unreadable symbol on screen than halfway through a board.
A4, Letter and a clean print
Pick A4 or US Letter to match your paper before you export. When you print, choose “actual size” or 100% and let the chart fall where it may across pages — because it is a reading chart, it does not matter that a section spans a page break, only that the grid stays legible. If cells look cramped, a larger paper size or splitting a very wide pattern across prints reads better than shrinking everything to fit one sheet.
The other three exports
The PDF is one of four exports, each for a different job. Reach for the right one instead of forcing the PDF to do everything:
| Export | What it is | Use it when |
|---|---|---|
| Reading chart: sections, symbols, counts | You are beading from paper | |
| PNG | The grid as an image, empty cells transparent | Sharing a preview or a thumbnail |
| CSV | Exact bead counts per color | Shopping for beads or checking stock |
| JSON | Editable project, with the original image if you keep it | Backing up or continuing later on any device |
The JSON export is the one to keep. It stores the confirmed grid and its protection, and optionally the original image, so you can reopen and edit the project later — a grid-only backup is smaller but cannot regenerate new sizes because it has no original to sample.